---
title: "Gemma-4 on the DGX Spark: the price of context"
description: "Nine benchmarks of Gemma-4-26B-A4B-it on the DGX Spark with llama-benchy and vLLM. Decode holds up; prefill and queueing decide how it feels."
canonical: "https://djangodevreng.nl/en/blog/gemma-4-dgx-spark-benchmarks/"
pubDate: "2026-05-01T00:00:00.000Z"
updatedDate: "2026-05-02T00:00:00.000Z"
category: "on-prem"
---
I wanted to know how well a DGX Spark holds up as a local AI machine for an office environment.
Not in theory. Just: load Gemma-4-26B-A4B-it into vLLM, throw llama-benchy at it, make context windows bigger, output longer, concurrency higher, add multi-turn, and watch where it stays pleasant and where the wait starts to hurt. And once that story started taking shape, a second question came up: what if I stop testing in lockstep and let requests arrive organically, the way they would in a real office? For that I pulled in vLLM's own benchmark suite, which does what llama-benchy does not: Poisson arrivals, percentiles, real conversation data. How I measure all of this is in the [methodology](/en/arena/methodology/).
The short version: for normal office use this looks good. Short to medium prompts, longer outputs, and even conversations across multiple turns keep feeling fast, even with ten users at once. With large context windows the problem is not tokens per second, but how long someone stares at an empty chat window before the first token arrives. And if you really overload the machine, it does not scale, it queues.
That makes this not a "can the DGX Spark do it or not" story. It makes it a workload story. Nine tests, two methods, one machine. It is one of the build logs under the guide [running LLMs on the DGX Spark](/en/dgx-spark/).
## Why this test
With on-prem AI you quickly end up talking about privacy, keeping data closer, and being less dependent on hosted models. That is all true, but eventually a flatter question follows.
Can the machine handle it?
A local model that neatly answers one demo prompt is nice. But production rarely looks like that. There you have multiple users, larger context, agent flows, tool-calls, retries, and sometimes someone who pastes half a novel into a ticket.
So I did not want to measure only tokens per second on one prompt. I wanted to see what happens when you load the machine from different angles: from "ten users, short prompts, long answers" to "ten users, five-turn conversations, growing memory" to "requests that arrive organically like in a real office, not all at once and not all the same size".
For these benchmarks I tested one model:
- `google/gemma-4-26B-A4B-it`
- BF16
- DGX Spark, NVIDIA GB10, 128 GB unified memory
- vLLM as OpenAI-compatible endpoint
Dense comes later. MoE vs dense too. This piece is only about Gemma-4-26B-A4B-it on the DGX Spark. This run is on BF16; what happens to the same Gemma-4 when you [quantize to NVFP4](/en/blog/gemma-4-nvfp4-vs-bf16-dgx-spark/) is a separate story.
## What I expected up front
My expectation was simple: MoE would stay reasonably good under concurrent requests, but I thought the DGX Spark would hit its limits faster once the context grew large.
Especially at 25k context.
Context is expensive. You pay not only for the prompt coming in, but also for the KV-cache that vLLM has to keep around. Multiply that by multiple users and it suddenly becomes a memory problem and a queueing problem.
I was curious about five things:
1. does decode stay usable as context grows?
2. how much does prefill add to the time to first token?
3. what happens when the prompt is short but the output long?
4. how does it behave with multi-turn conversations, where context thickens per turn?
5. and (added only later) what does all of this look like when requests do not come in lockstep, but organically?
That last question turned out to be half the story.
## The test setup
The server ran in Docker with the official vLLM image:
```bash
docker run -d --name vllm-bench \
--gpus all --ipc=host \
-v appliance_hf-cache:/root/.cache/huggingface \
-p 8000:8000 \
vllm/vllm-openai:v0.20.1 \
--model google/gemma-4-26B-A4B-it \
--served-model-name gemma-4-26b-a4b-bf16 \
--max-model-len 131072 \
--gpu-memory-utilization 0.95 \
--kv-cache-dtype fp8 \
--limit-mm-per-prompt '{"image":0,"audio":0}' \
--async-scheduling \
--no-enable-prefix-caching \
--host 0.0.0.0 \
--port 8000
```
A few details matter.
Prefix caching is deliberately off. I wanted to see the raw prefill cost first, not a benchmark that looks nicer because the prompts resemble each other.
The KV-cache runs on fp8. Without it, 128k context with multiple concurrent requests quickly becomes a memory exercise that gets you nowhere.
**All nine tests below use exactly this server config.** No restart, no mid-run change. What varies is the workload: prompt size, output size, concurrency, depth, and for the open-loop tests also arrival rate and burstiness.
What the Spark makes of this:
| Component | Value |
| --- | ---: |
| Model weights (BF16) | ~48 GB |
| KV-cache headroom (fp8) | ~65 GB |
| Theoretical parallel @ 128k | ~4 requests |
| Theoretical parallel @ 8k | ~50 requests |
At full context per request, memory is tight. In practice no test uses 128k at once per user, so the bottleneck shifts to prefill compute and scheduler batching. We see that below.
## Run A: making the context bigger
The first run grew the context from 4k to 25k. Concurrency went along from 1 to 5 and 10. Closed-loop, so N users in lockstep.
```bash
uvx llama-benchy \
--base-url http://localhost:8000/v1 \
--model gemma-4-26b-a4b-bf16 \
--pp 4096 8192 16384 25000 \
--tg 256 \
--depth 0 \
--concurrency 1 5 10 \
--runs 3 \
--latency-mode generation \
--format md
```
`pp` is prefill, that is how many prompt tokens go in. `tg` is decode, that is how many tokens the model generates afterwards. llama-benchy reports mean ± stddev. No p95. That is important to remember, because with latency you otherwise quickly fool yourself into optimism.
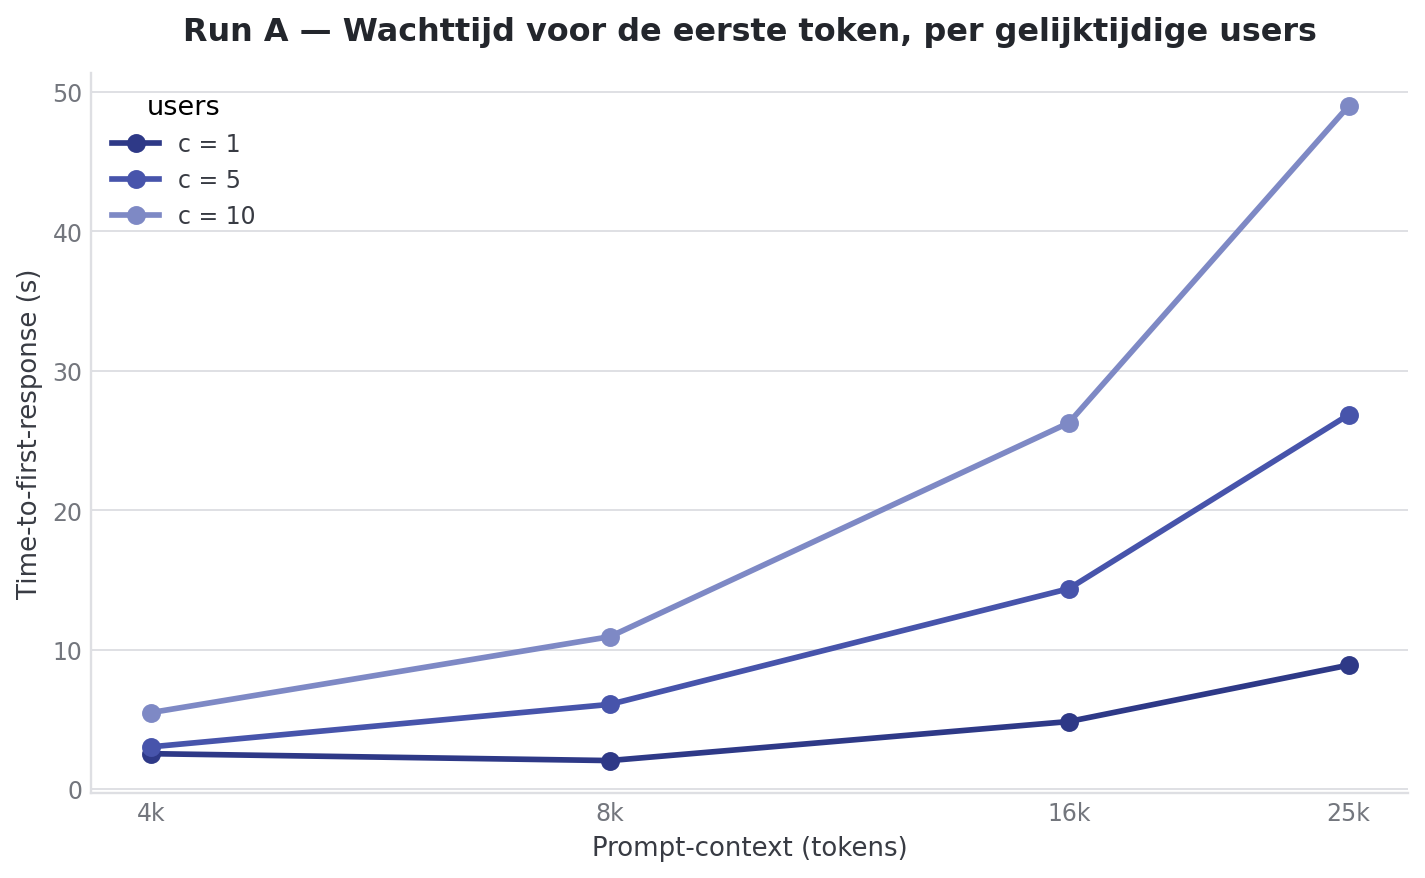
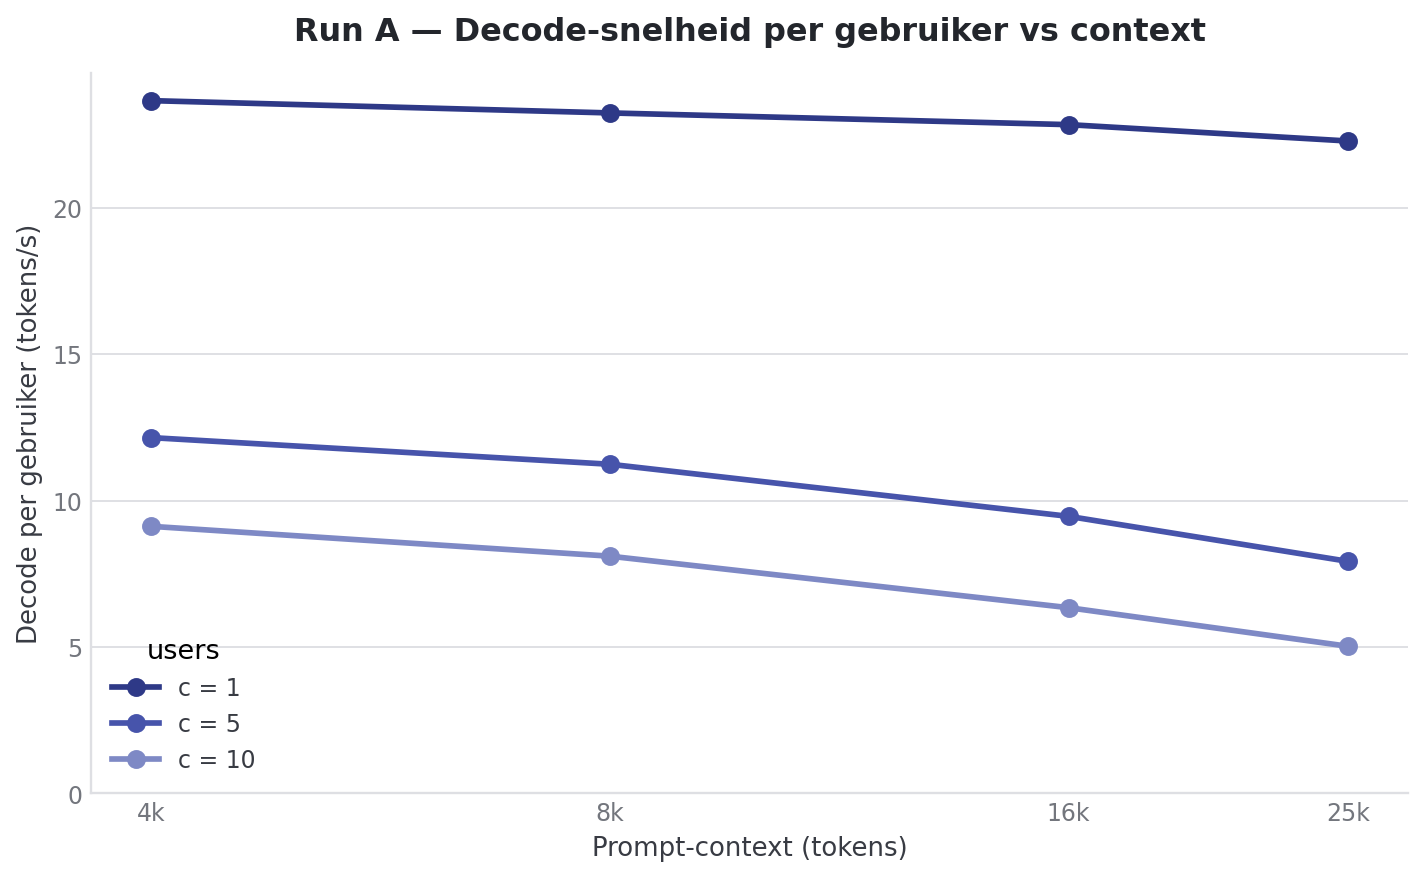
This is the summary from Run A:
| Context | Users | Prefill total | Decode/user | Decode total | TTFT |
| ---: | ---: | ---: | ---: | ---: | ---: |
| 4k | 1 | 3677.85 ± 1259.27 tok/s | 24.08 ± 0.02 tok/s | 24.08 ± 0.02 tok/s | 1.37 ± 0.52s |
| 4k | 5 | 5722.96 ± 94.70 tok/s | 12.55 ± 0.49 tok/s | 57.07 ± 2.64 tok/s | 2.29 ± 0.82s |
| 4k | 10 | 5475.53 ± 888.14 tok/s | 9.48 ± 0.73 tok/s | 84.40 ± 3.08 tok/s | 4.46 ± 2.38s |
| 8k | 1 | 6121.87 ± 62.31 tok/s | 23.69 ± 0.02 tok/s | 23.69 ± 0.02 tok/s | 1.39 ± 0.01s |
| 8k | 5 | 5444.57 ± 12.82 tok/s | 11.48 ± 0.92 tok/s | 49.42 ± 1.60 tok/s | 4.34 ± 1.91s |
| 8k | 10 | 5478.98 ± 11.48 tok/s | 8.52 ± 1.10 tok/s | 67.72 ± 0.91 tok/s | 7.99 ± 4.03s |
| 16k | 1 | 4607.64 ± 23.05 tok/s | 23.34 ± 0.05 tok/s | 23.34 ± 0.05 tok/s | 3.42 ± 0.00s |
| 16k | 5 | 4466.35 ± 27.19 tok/s | 10.05 ± 1.75 tok/s | 38.41 ± 0.12 tok/s | 10.43 ± 4.69s |
| 16k | 10 | 4453.92 ± 18.19 tok/s | 6.79 ± 1.62 tok/s | 45.76 ± 0.43 tok/s | 18.92 ± 9.43s |
| 25k | 1 | 3621.25 ± 18.50 tok/s | 22.75 ± 0.08 tok/s | 22.75 ± 0.08 tok/s | 6.39 ± 0.05s |
| 25k | 5 | 3561.78 ± 9.23 tok/s | 8.46 ± 2.36 tok/s | 27.93 ± 0.08 tok/s | 19.63 ± 8.87s |
| 25k | 10 | 3565.35 ± 8.21 tok/s | 5.40 ± 2.00 tok/s | 30.73 ± 0.12 tok/s | 35.67 ± 18.00s |
Run A: Wait time for the first token, per concurrent users. Double the prompt and you double the wait.Run A: Decode per user. With one user it stays almost flat; only with multiple users and large context does it collapse.
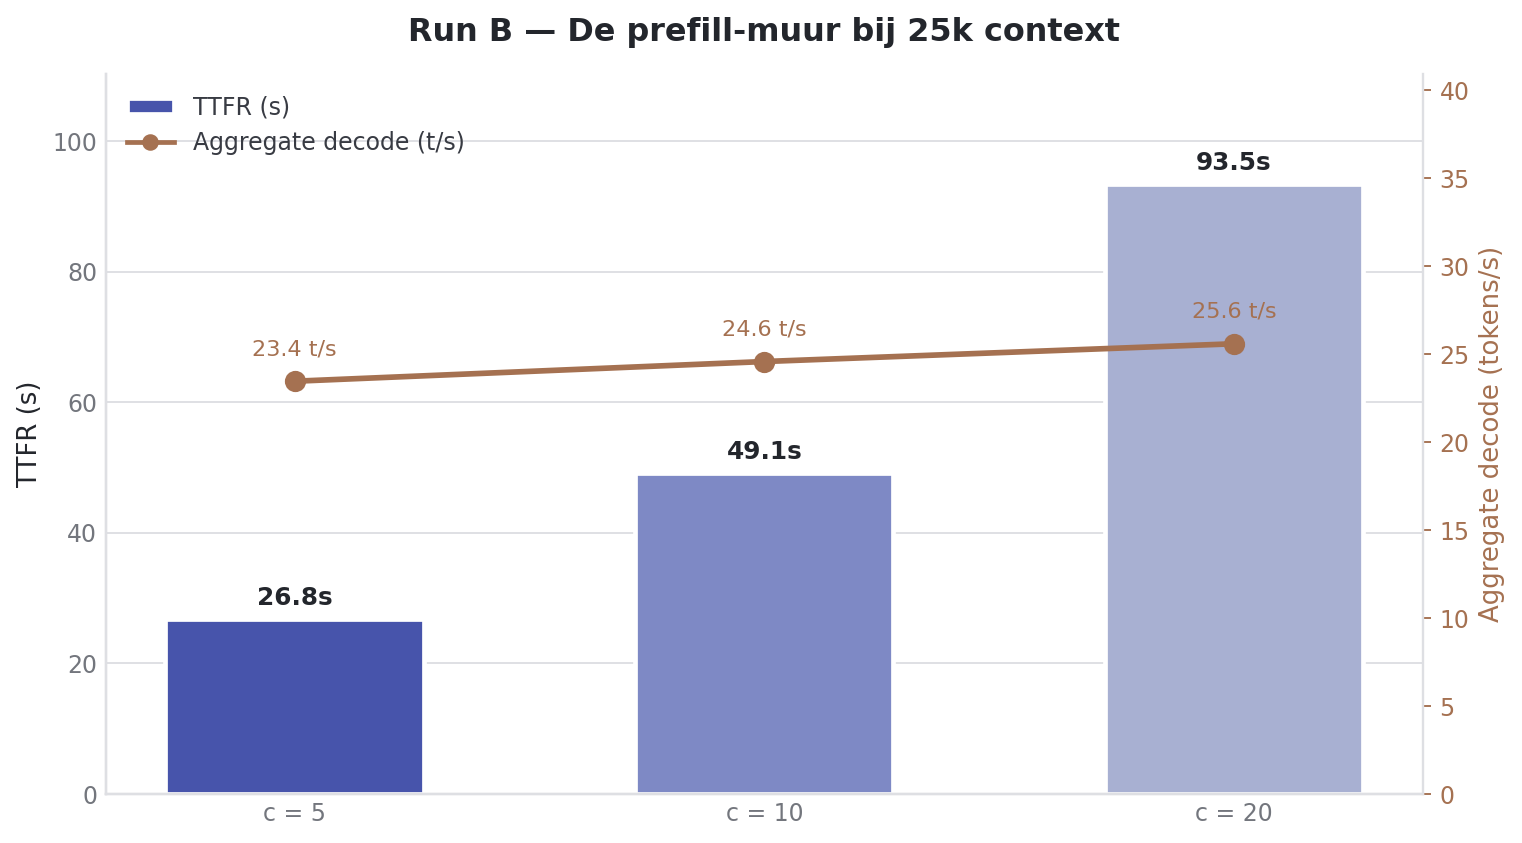
## Run B: holding 25k context, concurrency up
After that I ran the same 25k context harder. No longer varying the context, only adding users.
```bash
uvx llama-benchy \
--base-url http://localhost:8000/v1 \
--model gemma-4-26b-a4b-bf16 \
--pp 25000 \
--tg 256 \
--depth 0 \
--concurrency 5 10 20 \
--runs 3 \
--latency-mode generation \
--exit-on-first-fail \
--format md
```
No OOM. No crash. The DGX Spark survived 20 concurrent requests at 25k context.
| Users | Prefill total | Decode/user | Decode total | TTFT |
| ---: | ---: | ---: | ---: | ---: |
| 5 | 3559.17 ± 6.72 tok/s | 8.51 ± 2.40 tok/s | 27.88 ± 0.05 tok/s | 19.86 ± 9.00s |
| 10 | 3569.77 ± 2.99 tok/s | 5.37 ± 1.99 tok/s | 30.68 ± 0.09 tok/s | 35.44 ± 17.95s |
| 20 | 3563.64 ± 8.78 tok/s | 3.16 ± 1.41 tok/s | 32.26 ± 0.10 tok/s | 67.37 ± 36.44s |
Run B: Aggregate decode sticks at ~30 tok/s; all the extra wait goes into TTFT.
This is the stress edge of the benchmark. Aggregate decode sticks around 30 tok/s, regardless of whether you put 5, 10 or 20 users on it. Per user it drops from 8.51 to 3.16 tok/s. But the real problem is TTFT: at 20 users the average request waits 67 seconds before the first token arrives. The server is not broken then. The workload just no longer fits a realtime chat expectation.
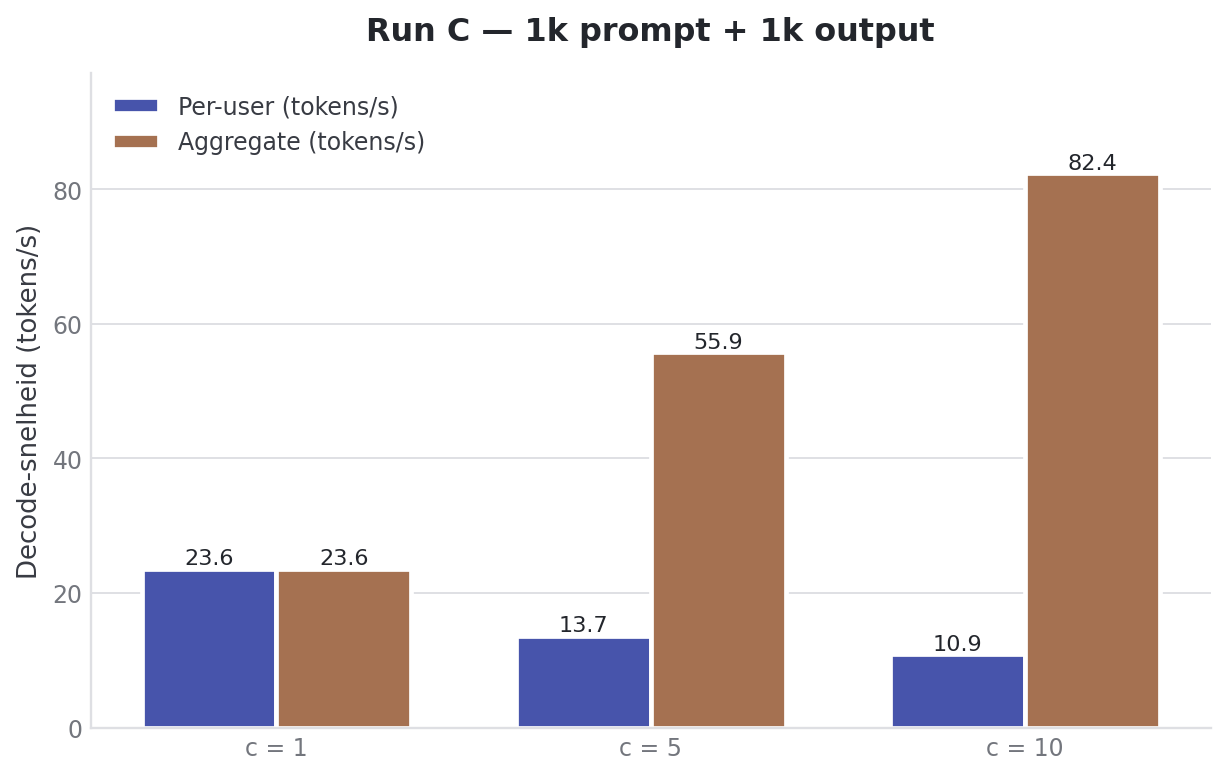
## Run C: short prompt, long output
Run C flipped the shape. Not 25k context with short output, but 1024 prompt tokens and 1024 output tokens.
| Users | Prefill total | Decode/user | Decode total | TTFT |
| ---: | ---: | ---: | ---: | ---: |
| 1 | 4627.12 ± 374.91 tok/s | 23.86 ± 0.03 tok/s | 23.86 ± 0.03 tok/s | 0.31 ± 0.02s |
| 5 | 5701.55 ± 561.36 tok/s | 13.59 ± 1.05 tok/s | 54.67 ± 4.90 tok/s | 0.76 ± 0.11s |
| 10 | 6346.87 ± 64.52 tok/s | 10.92 ± 0.73 tok/s | 86.46 ± 1.74 tok/s | 1.26 ± 0.40s |
Run C: short prompt, long output. Aggregate decode scales neatly to 86 tok/s, per-user stays comfortably readable.
At ten users at once, TTFT stays at 1.3 seconds. That feels like chat.
## Run G: even longer output
Runs A, B and C showed enough to make the "decode is stable, prefill decides the wait" story plausible. But one scenario stayed open: what if the output is much longer still? An agent generating code. A tool-call with structured output. A long summary.
| Users | Prefill total | Decode/user | Decode total | TTFT |
| ---: | ---: | ---: | ---: | ---: |
| 1 | 1993.94 ± 262.05 tok/s | 24.17 ± 0.02 tok/s | 24.17 ± 0.02 tok/s | 0.24 ± 0.01s |
| 5 | 3048.28 ± 496.15 tok/s | 14.32 ± 2.18 tok/s | 46.11 ± 11.57 tok/s | 0.38 ± 0.07s |
| 10 | 4800.80 ± 50.75 tok/s | 11.75 ± 0.68 tok/s | 83.77 ± 4.04 tok/s | 0.48 ± 0.01s |
Run G: 4k output: long generations are only longer, not slower. Per-user sits close to Run C.
Decode/user over 4096 tokens barely drops compared to C's 1024 tokens. At c=1 it is 24.17 (G) vs 23.86 (C). At c=10 it is 11.75 (G) vs 10.92 (C). Long generations do not compound, they just take proportionally longer. And TTFT is lowest here: under half a second at ten users at once.
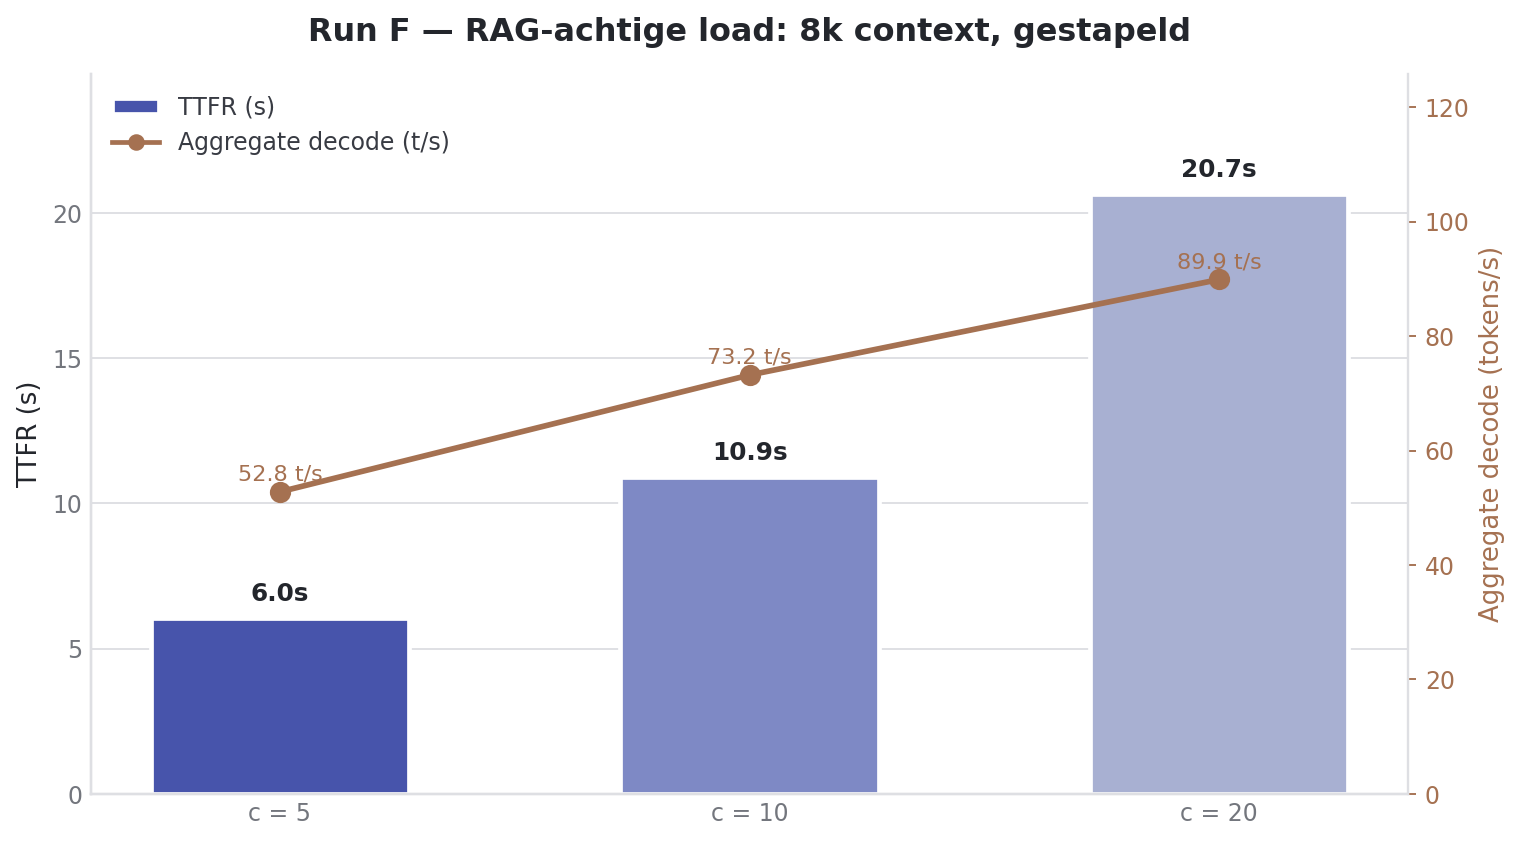
## Run F: medium context, more users
Between Run C (1k context) and Run B (25k context) sat a gap that is closer to reality. A typical RAG flow with four chunks of ~2k tokens comes out around 8k.
| Users | Prefill total | Decode/user | Decode total | TTFT |
| ---: | ---: | ---: | ---: | ---: |
| 5 | 5439.51 ± 32.60 tok/s | 12.11 ± 0.51 tok/s | 55.21 ± 1.49 tok/s | 4.32 ± 1.90s |
| 10 | 5466.71 ± 15.65 tok/s | 9.31 ± 0.77 tok/s | 78.36 ± 1.61 tok/s | 7.99 ± 4.02s |
| 20 | 5532.74 ± 5.39 tok/s | 6.05 ± 0.62 tok/s | 97.35 ± 3.50 tok/s | 14.61 ± 7.72s |
Run F: 8k context. TTFT grows linearly with concurrency, aggregate decode keeps scaling to almost 100 tok/s.
Three observations.
Prefill throughput sits at a flat 5.5k tok/s, regardless of whether it is 5, 10 or 20 users. At 8k context the machine is already saturated at the prefill level. Aggregate decode keeps scaling: in Run B (25k) this plateaued at ~30 t/s, here it runs up to 97.4 t/s. And most importantly: TTFT at 8k context is roughly a quarter of what it is at 25k. Same concurrency, same machine, different prompt size.
## Run E: multi-turn as realistic office work
`--depth 4` means: five turns in a row per request (initial + four follow-ups). Concurrency at 10 means: ten such conversations in parallel.
| Users | Prefill total | Decode/user | Decode total | TTFT |
| ---: | ---: | ---: | ---: | ---: |
| 1 | 4716.21 ± 542.88 tok/s | 23.97 ± 0.10 tok/s | 23.97 ± 0.10 tok/s | 0.53 ± 0.06s |
| 5 | 5693.39 ± 128.08 tok/s | 13.07 ± 0.16 tok/s | 59.48 ± 2.26 tok/s | 1.32 ± 0.39s |
| 10 | 6096.81 ± 56.92 tok/s | 10.43 ± 0.35 tok/s | 92.42 ± 3.33 tok/s | 2.13 ± 0.83s |
Run E: multi-turn (depth = 4) at 2k starting context. Aggregate of 92 tok/s is the highest number across all six closed-loop runs.
Three things stood out that I had not expected up front.
Per-user decode with multi-turn is identical to single-turn. Multi-turn does not make the tokens slower, only the number of prefills goes up. Aggregate decode at c=10 is 92.42 t/s, the highest of any closed-loop run. With multi-turn, vLLM gets a denser stream of dependent requests fed to it, and can batch those more efficiently than ten separate single-shot prompts. And TTFT at c=10 averages 2.13 seconds across all five turns. Under three seconds still feels like chat.
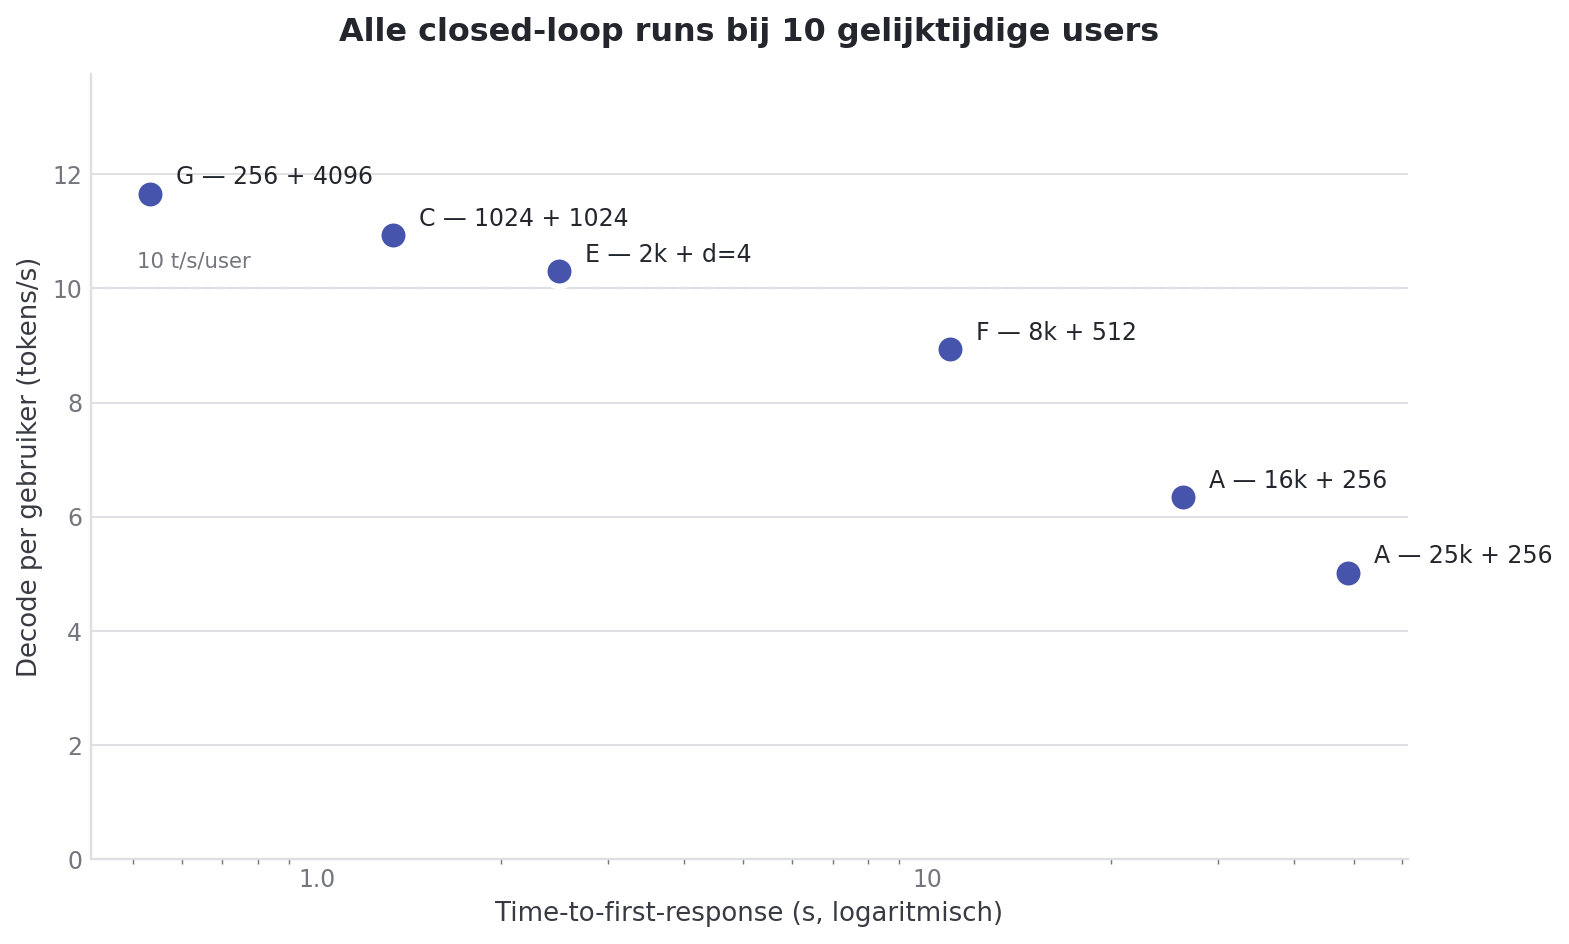
## What the six closed-loop runs show together
One table that puts everything at c=10 side by side:
| Run | Prompt | Output | Depth | TTFT (c=10) | Decode/user (c=10) | Aggregate decode (c=10) |
| --- | ---: | ---: | ---: | ---: | ---: | ---: |
| G | 256 | 4096 | 0 | 0.48s | 11.75 t/s | 83.8 t/s |
| C | 1024 | 1024 | 0 | 1.26s | 10.92 t/s | 86.5 t/s |
| E | 2048 | 512 | 4 | 2.13s | 10.43 t/s | 92.4 t/s |
| F | 8192 | 512 | 0 | 7.99s | 9.31 t/s | 78.4 t/s |
| A | 16384 | 256 | 0 | 18.92s | 6.79 t/s | 45.8 t/s |
| A/B | 25000 | 256 | 0 | 35.67s | 5.40 t/s | 30.7 t/s |
All six closed-loop runs at 10 concurrent users. Decode per user barely moves up to 8k context. TTFT moves everywhere.
Two patterns jump out.
Decode/user barely moves up to 8k context. Between Run G and Run F there is a factor of 32 in prompt size and a factor of 8 in output size. Yet decode/user there sits between 9.3 and 11.8 tok/s. Only at 16k+ does that band collapse.
TTFT moves everywhere and is almost a function of prompt size alone. Double the prompt and the TTFT roughly doubles along with it. Output size and depth matter almost nothing for TTFT.
That is the closed-loop conclusion. It holds, and it tells a real part of the story. But there is a gap in it.
## But these are synthetic tests
The six runs above test capacity. *Ceilings.* All in the same shape: N users in lockstep, all the same prompt size, all hitting send buttons at the same time. That is a fine way to measure where it breaks. It is a bad way to measure how a real office feels.
Because a real office has 25 employees, of whom on average a few are doing something at the same time. One colleague asks a short question. Another is mid-RAG with 8k context. The third is in turn 4 of a conversation. And requests do not arrive in lockstep. They arrive as a Poisson process with the occasional burst, because someone just finished an email and three colleagues all want coffee at once.
That is what **vLLM's own `vllm bench serve`** can do and llama-benchy cannot:
- **Open-loop** with arrival rate. Dispatch requests according to a Poisson or Gamma distribution, instead of lockstep.
- **Percentiles.** P50, P90, P95, P99 on TTFT, TPOT (time per output token), ITL (inter-token latency) and E2E. No more mean ± stddev.
- **Realistic datasets.** ShareGPT replay of 94k+ real conversations with naturally varying prompt lengths and multi-turn structure.
- **Mixed workloads.** Sample prompts from a distribution instead of testing one fixed shape.
Three tests below, same server (no restart), but with those other glasses on.
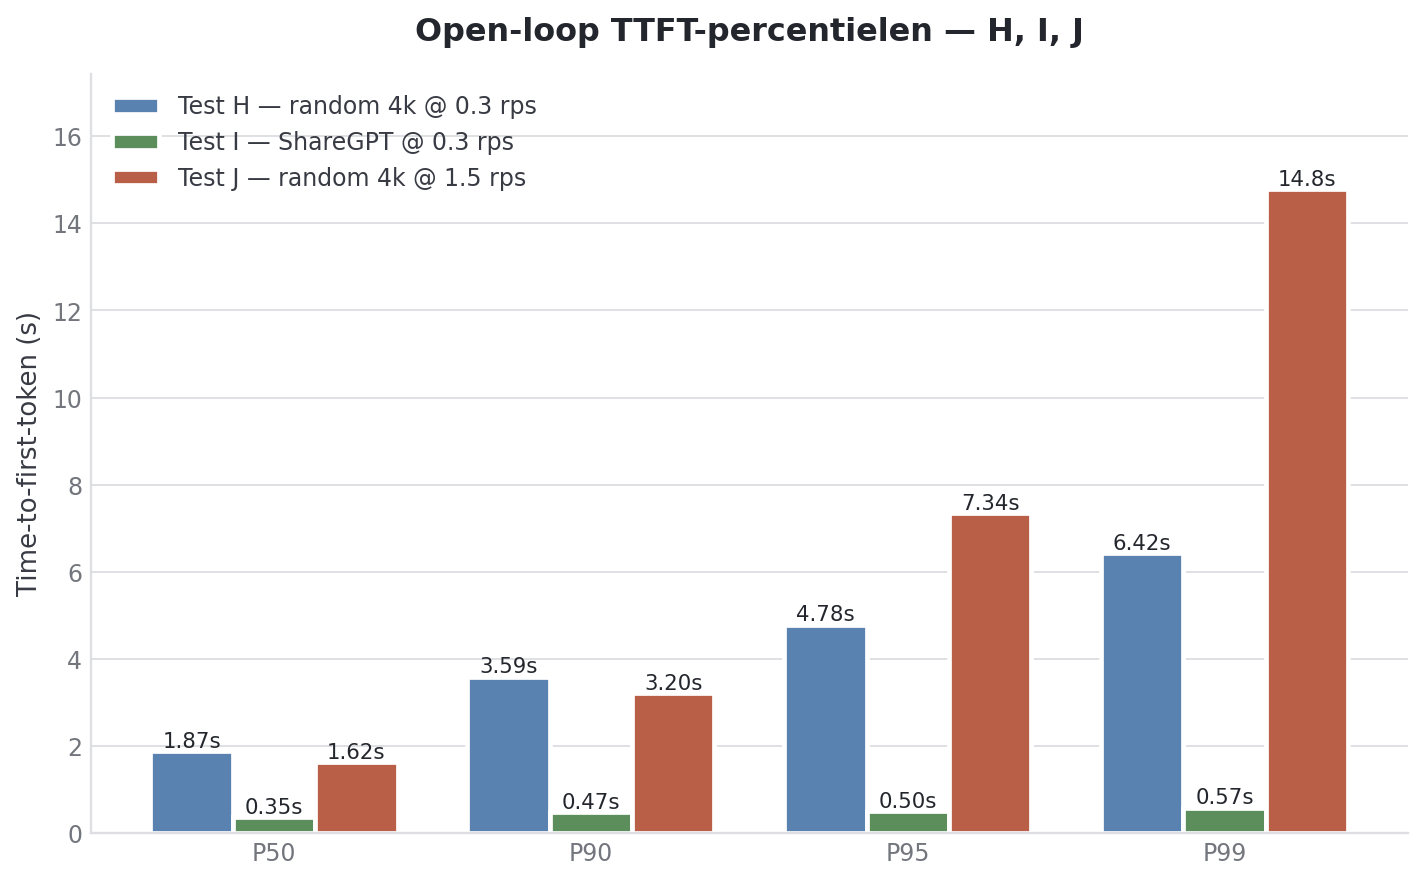
## Test H: realistic office baseline
The scenario: 25 people active on average, each sends a prompt roughly once per 1-2 minutes, prompts vary widely in length. Arrivals are slightly clumpy.
```bash
docker exec vllm-bench vllm bench serve \
--backend openai-chat \
--base-url http://localhost:8000 \
--endpoint /v1/chat/completions \
--model google/gemma-4-26B-A4B-it \
--tokenizer google/gemma-4-26B-A4B-it \
--served-model-name gemma-4-26b-a4b-bf16 \
--dataset-name random \
--random-input-len 4000 \
--random-output-len 500 \
--random-range-ratio 0.9 \
--num-prompts 200 \
--request-rate 0.3 \
--burstiness 0.7 \
--percentile-metrics ttft,tpot,itl,e2el \
--metric-percentiles 50,90,95,99 \
--seed 42
```
With `--random-range-ratio 0.9`, input lengths vary from 399 to 7600 tokens, outputs from 49 to 950. `--burstiness 0.7` is slightly clumpier than pure Poisson. People often hit enter in little bursts, not like a metronome. Target rate of 0.3 req/s = ~18 prompts/min across 25 users.
| Metric | Value |
| --- | ---: |
| Successful requests | 200 / 200 |
| Achieved RPS | 0.27 (target 0.30) |
| **Peak concurrent requests** | **36** |
| Total token throughput | 1215 tok/s |
| | Mean | P50 | P90 | P95 | P99 |
| --- | ---: | ---: | ---: | ---: | ---: |
| **TTFT (ms)** | 1395 | 1286 | 2284 | 2644 | 3316 |
| **TPOT (ms)** | 177 | 182 | 193 | 202 | 214 |
| **E2E (ms)** | 85921 | 85306 | 150192 | 162375 | 171351 |
The median user gets the first token in 1.29s. Still feels like chat. The tail stays within bounds: P99 waits 3.3 seconds, comfortably under twice the average.
And look at peak concurrent: **36**. At a target rate of just 0.3 req/s. No closed-loop run came near that. The Poisson burstiness alone, combined with an average response time of ~86 seconds, produces peaks heavier than any Run B stress test had. That is the thing closed-loop literally cannot show.
## Test I: real conversations (ShareGPT replay)
Identical arrival pattern to Test H, but now with 250 real multi-turn conversations from ShareGPT V3 as prompts. Some are 1 turn of 200 tokens, others are 15 turns with ever-growing context.
```bash
docker exec vllm-bench vllm bench serve \
... \
--dataset-name sharegpt \
--dataset-path /tmp/ShareGPT_V3.json \
--num-prompts 250 \
--request-rate 0.3 \
--burstiness 0.7
```
| Metric | Value |
| --- | ---: |
| Successful requests | 250 / 250 |
| Achieved RPS | 0.30 (target 0.30) |
| **Peak concurrent requests** | **17** |
| Total token throughput | 133 tok/s |
| | Mean | P50 | P90 | P95 | P99 |
| --- | ---: | ---: | ---: | ---: | ---: |
| **TTFT (ms)** | 376 | 353 | 469 | 509 | 637 |
| **TPOT (ms)** | 93 | 95 | 117 | 123 | 135 |
| **E2E (ms)** | 19600 | 10923 | 49525 | 63036 | 82596 |
This is a different universe than Test H. **TTFT P99 = 637 ms.** 99% of users see the first token within 650 milliseconds. That is genuine chat speed.
Identical arrival pattern to Test H, completely different experience. The difference is entirely in prompt size: ShareGPT conversations average 228 tokens, not 4000. Short prompt = cheap prefill = no queue pressure = sub-second TTFT.
| Metric | Test H (random 4k) | Test I (ShareGPT) |
|---|---:|---:|
| Achieved RPS | 0.27 | 0.30 |
| Peak concurrent | 36 | 17 |
| TTFT P50 | 1286 ms | 353 ms |
| TTFT P99 | 3316 ms | 637 ms |
| TPOT P50 | 182 ms | 95 ms |
This is also a warning: the synthetic workload of Test H *overstates* how heavy an average office prompt is. Real-world conversations are lighter than our 4k random baseline, so the real-world numbers probably sit closer to Test I than to Test H.
## Test J: Monday morning peak
What if everyone comes in at the same time and starts hitting send buttons? Fivefold load, max 25 concurrent requests to model a real office.
```bash
docker exec vllm-bench vllm bench serve \
... \
--dataset-name random \
--random-input-len 4000 \
--random-output-len 500 \
--random-range-ratio 0.9 \
--num-prompts 300 \
--request-rate 1.5 \
--burstiness 1.0 \
--max-concurrency 25
```
| Metric | Value |
| --- | ---: |
| Successful requests | 300 / 300 |
| Configured RPS | 1.50 |
| **Achieved RPS** | **0.26** |
| Peak concurrent requests | 27 |
| Total token throughput | 1173 tok/s |
| | Mean | P50 | P90 | P95 | P99 |
| --- | ---: | ---: | ---: | ---: | ---: |
| **TTFT (ms)** | 1370 | 1132 | 1932 | 2961 | 6157 |
| **TPOT (ms)** | 185 | 187 | 195 | 199 | 221 |
| **E2E (ms)** | 92752 | 91099 | 165179 | 172073 | 179139 |
This is the key number: **achieved rate 0.26 at target 1.5**. The system is **throttled almost 6x**. Not because it crashes (all 300 requests succeed, no failures), but because the queue fills up to 25 and holds requests there until there is room.
Compare Test H (target 0.3) and Test J (target 1.5):
| Metric | Test H (0.3 rps) | Test J (1.5 rps) |
|---|---:|---:|
| Achieved RPS | 0.27 | 0.26 |
| TTFT P50 | 1286 ms | 1132 ms |
| TTFT P95 | 2644 ms | 2961 ms |
| TTFT P99 | 3316 ms | 6157 ms |
| TPOT P50 | 182 ms | 187 ms |
The median experience is even *slightly better* in Test J than in Test H (1.13s vs 1.29s). The cap creates a smoother stream. But the tail is dramatically worse: P99 doubles from 3.3s to 6.2s.
Open-loop TTFT percentiles. The median says little; the tail tells you where overload hurts.
The Spark does not scale under oversubscribe, it **queues**. That is good news: graceful degradation instead of crashes. For on-prem AI that is really the best failure mode.
## What closed-loop hides, what open-loop overstates
The two methods each tell a different part of the story. Both true, both incomplete.
**Closed-loop underestimates queue depth.**
In Run F I tested c=10 as "ten users at once". That sounds like a reasonably busy office situation. But Test H shows that an organic 0.3 req/s arrival rate is already enough to produce peaks of 36 concurrent requests. So the closed-loop "10 users" claim is more optimistic than practice shows.
**Open-loop with synthetic overstates the real load.**
At the same time: Test H uses random 4k prompts. A real office does not pose 25 average 4k prompts per minute. ShareGPT (Test I) is a much better proxy for "what people type", averaging 228 tokens. With that workload shape, peak concurrent is 17 instead of 36, and P99 TTFT 637ms instead of 3.3s.
So reality sits between Run F and Test I:
| Source | TTFT (P50 or mean) | Peak concurrent |
|---|---:|---:|
| Run F (closed-loop, 10 users, 8k) | 7.99 s | 10 |
| Test H (open-loop, 0.3 rps, 4k random) | 1.29 s P50 / 3.3s P99 | 36 |
| Test I (open-loop, 0.3 rps, ShareGPT) | 0.35 s P50 / 0.64s P99 | 17 |
| Test J (open-loop, 1.5 rps, 4k random, cap 25) | 1.13 s P50 / 6.2s P99 | 27 |
For an office with realistic prompts and a realistic arrival pattern, Test I is closest to what people feel. For capacity planning ("what if everyone asks an 8k RAG question at once?"), Run F is closest to what the machine can chew through.
## The tail tells what the average hides
llama-benchy gave only mean ± stddev. That sounds like a lot of information, but it hides the part that matters most to your users: the tail.
Test I's mean TTFT is 376ms. Sounds fine. But what does that say about the 1% of users where the queue just spiked? Nothing. For that you need P99, and that sits at 637ms. In this case no problem (both sub-second), but the *principle* you need to know.
Test H's mean TTFT is 1395ms. P99 is 3316ms. Comfortably more than twice as bad as the average for the unlucky 1%.
Test J's mean TTFT is 1370ms. P99 is **6157ms**. Comfortably four times the average.
For SLA decisions ("our system answers within 3 seconds for 95% of requests") you need these percentiles. Mean ± stddev can suggest an SLA you do not hit at the moments that matter most, namely when it is busy.
That is why the blog cannot land on llama-benchy alone. Testing capacity is one thing. Reporting tail latency is another.
## Decode is not the problem
With one user, decode stays almost flat.
4k context gets 24.08 tok/s per user. 25k context gets 22.75 tok/s. 4096 output tokens (Run G, c=1) gets 24.17 tok/s. Multi-turn with depth 4 (Run E, c=1) gets 23.97 tok/s. Four different workloads, all within 6 percent of each other.
At ten users at once something similar happens, only on a lower line. Run G: 11.75 tok/s/user. Run C: 10.92. Run E: 10.43. Run F: 9.31. And in the open-loop tests: Test I gives TPOT P50 = 95ms = ~10.5 tok/s/user. Test H and J give TPOT P50 = ~185ms = ~5.4 tok/s/user (because peaks there hit 25+ concurrent).
In short: per-token decode speed is a function of **average concurrent load**, not of prompt length, output length, multi-turn, or arrival pattern. Only at 16k+ context combined with multiple users (Run A) does it really drop below 7 t/s/user.
Concurrency on its own is not the problem. Long output isn't either. Multi-turn isn't either. Only large context together with multiple users eats decode.
## Prefill is the wall
What you feel first is waiting.
With one user at 25k context it takes a good 6 seconds before the first response comes. At five users that becomes 19.9 seconds. At ten it becomes 35.4 seconds. At twenty it becomes 67.4 seconds.
Run F shows that this is linear in *both* concurrency and context. 8k context at 20 users gives 14.6 seconds, roughly a quarter of the 67.4 seconds at 25k context, for the same concurrency. Halve the prompt, halve the wait.
And Test J shows: as soon as you push the system past its throughput ceiling, all that extra wait goes into the **tail**. Median TTFT stays stable around 1.1-1.3s, but P99 shoots to 6 seconds. The pain of overload falls on a small group, not on everyone.
That is where the real limit sits.
Not: can the DGX Spark generate tokens? Yes.
Not: can the KV-cache handle 20 × 25k? Also yes.
Not: does it stop under overload? No, it queues along nicely.
But: does this still feel like chat? Not for 25k. For 8k it is already borderline. For 2k with multi-turn just fine. For ShareGPT-realistic prompts with 25 users spread organically: a crystal-clear yes.
## Where this does fit
These benchmarks make the on-prem choice more concrete.
**Yes for an office environment where 10 to 25 people use local AI spread across the day.** Test I is the proof: 250 real ShareGPT conversations, 0.3 req/s arrival rate, P99 TTFT of 637ms. The median user sees the first token in 353 milliseconds. That is exactly the office scenario, and this is what it feels like.
**Yes for RAG flows with medium context.** Run F gave the numbers up front: 8k prompt, 10 users, 8s TTFT, 9.3 tok/s streaming. Test H confirms the open-loop variant is still workable: P99 TTFT 3.3s. Not realtime, but within waitable bounds.
**Yes for agents and code generation.** Run G is the confirmation: short instruction, 4k+ tokens output, ten parallel tasks. TTFT under half a second, 11.75 tok/s/user.
**Yes for multi-turn conversations.** Run E gives 2.1s TTFT at 10 parallel 5-turn conversations. Decode the same as single-turn.
**Careful with 5+ users at 25k context at once.** 19.9 seconds TTFT is no longer chat, but workable for analysis.
**Careful with SLA claims based on averages.** Test H's mean TTFT of 1.4s could sound acceptable, but P99 sits at 3.3s. Decisions based on percentiles, not on mean.
**No for support chat where ten to twenty users send 25k context per session at once and all expect a realtime answer.** Or: support chat under Test J-like load (1.5 rps of 4k prompts). That can technically run (no failures), but P99 TTFT of 6 seconds is a borderline case for chat.
## What these tests do not say
This is not a MoE-vs-dense comparison. I want to test that separately, and then not only with throughput. If you compare MoE and dense, you also have to test prompts: summarizing, code questions, tool choice, ticket classification, a long context piece with follow-up steps. Otherwise you only measure how hard the engine spins, not whether it is driving the right way.
This is also not a test with prefix caching on. That is deliberate. I wanted to see the raw prefill cost, not a benchmark that looks nicer because the prompts resemble each other. A next piece will add it: those same 8k and 25k context runs and the open-loop tests with `--enable-prefix-caching`. My hunch: Test H and J benefit modestly (random data, little overlap), Test I benefits considerably (real conversations have overlapping system prompts and context), and Run F gets substantially faster. But that needs measuring.
## Where I land
My expectation up front was that the DGX Spark with this MoE model would fill up sooner at large context windows. That happened, but differently than I thought.
Memory was not the showstopper. Run B managed 20 users at 25k context without OOM. Test J survived 1.5 req/s without a single failed request. The practical limit always sat in prefill latency, not in capacity.
And after nine tests it turns out: that is really the only limit you feel.
Decode/user is almost a constant for this machine. Between 9 and 12 tokens per second at ten concurrent users, across six different closed-loop workloads. In open-loop with realistic ShareGPT prompts: 10.5 t/s/user. Only at 16k context or at synthetic peaks of 25+ concurrent does that drop below 7 t/s.
What varies is how long someone waits before the text begins. At 256 prompt tokens that is half a second, even with ten users. At 2048 prompt tokens with five turns an average of 2.1 seconds. At 8192 prompt tokens with ten users eight seconds. At 25k with ten users 35 seconds. Under realistic 0.3 rps ShareGPT load: 353 milliseconds for the median, 637 milliseconds for the unlucky 1%.
And as soon as you push the system above its capacity, it does not scale, it queues. Test J showed that a 1.5 req/s target gets throttled to 0.26 achieved, with the pain entirely in the tail (P99 6.2s) while the median stays stable. For on-prem AI that is the best failure mode you can hope for: nobody crashes, some wait longer.
That is not a "can this machine do it or not". That is "pick the workload that fits what the user expects, and accept that 1% of requests has an unpleasant wait at peak moments".
For one to three users with large context it is usable. For ten users with medium context it is fine. For ten users with multi-turn conversations it is actually at its best. For a 25-person office with realistic prompts and an organic arrival pattern it is astonishingly good: sub-second TTFT for 99% of requests, measured on real conversation data.
For agent flows with long outputs it is strong. For twenty concurrent 25k prompts or for 1.5 rps oversubscribe it is no longer realtime chat. There you have to queue, turn on prefix caching, or route that kind of work differently.
Two methods measure two things. Closed-loop benchmarks show what the machine can do. Open-loop replay shows what the user feels. The DGX Spark is a strong local AI machine for office work, as long as you know which knob decides what you feel.
Decode sells the benchmark. Prefill decides the experience. And as soon as you go past the limit, the Spark queues instead of breaking, and that is the third number an on-prem choice has to be able to read.